![]()
![]()
![]()
![]()

RI Coastal Resources Management Council
...to preserve, protect, develop, and restore coastal resources for all Rhode Islanders
![]()
![]()
![]()
![]()
...to preserve, protect, develop, and restore coastal resources for all Rhode Islanders
Illustrates and displays storm inundation, with and without sea level rise, for different types of storms that could occur along Rhode Island’s coast line.
The Coastal Resources Management Program (CRMP) has developed regulations for reconstruction after "the big one" as well as other severe storms (Section 180. Emergency Assents). More important are the regulations that are designed to minimize the impact of coastal hazards. Policies regulating where to build on a vulnerable property (Section 140. Setbacks), construction of shoreline protection facilities (various sections), and beneficial reuse of dredged materials help to mitigate some of the hazards associated with coastal living. Sea level rise is a hazard that is only indirectly addressed in the CRMP. Erosion setbacks are very effective regulations that protect the homeowner and the public resources. Much of the Rhode Island shoreline is eroding. Erosion rates are calculated by comparing the shoreline location from historic aerial photographs to the most recent shoreline position. Sections of the south shore barriers have erosion rates of more than three feet per year. That is an average rate over time. In reality, the shoreline may erode tens of feet in a single storm, followed by some accretion. In critical erosion areas on barriers, all residential construction with less than six units must be set back 30 times and commercial property 60 times the average annual erosion rate. The farther the house or commercial structure is setback from the shore, the longer it will last. Unfortunately, these regulations were enacted about thirty years ago. The Council may want to consider policy for when the setback is gone and the structure is on the active beach (figure 1).

Figure 1. House pilings in the wave swash. Old pilings and ISDS exposed after a storm.
Impacts of storm erosion on ISDS are a potential public health problem (figure 2). CRMC worked with RIDEM to develop regulations for repairs to ISDS in critical erosion areas (ISDS Repair Guidance in Critical Erosion Areas, January 31, 2006).
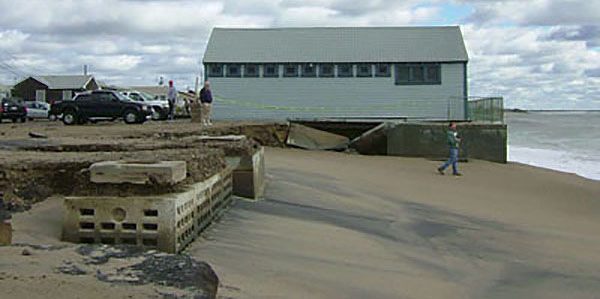
Figure 2. ISDS exposed by storm surge and waves.
Shoreline Protection Structures are prohibited along Type 1 shorelines except where they are used to protect historic structures that are listed on the National Register of Historic Places (Section 220). There are several reasons for this prohibition. The structures reflect wave energy, often causing erosion around the sides of the structure and can cause scouring seaward of the structure. In addition, the structures disrupt sediment transport, both by sequestering sediment that would normally erode from a bank or dune to form new beaches (figure 3), and by physically blocking the sand movement along the shoreline (figure 4). Shoreline protection structures often impact lateral public access along the shoreline. In other words, these structures help protect the property where they are built, but often harm adjacent properties. They are a contributing factor in the narrowing and loss of beaches, and they inhibit the public's right to lateral shoreline access (figure 5). Many of the structures that were built prior to the CRMP cannot withstand moderate storms (figure 6).
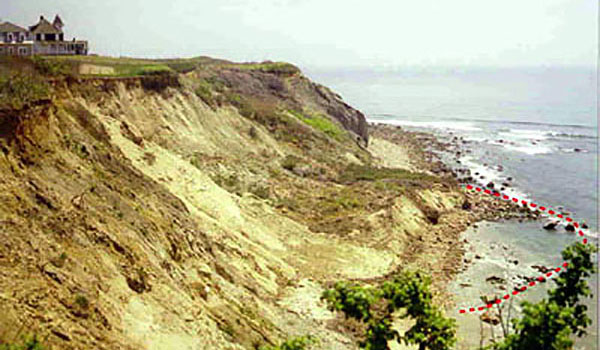
Figure 3. Sediment that erodes from the headland bluffs forms the beaches. The dotted line marks the extent of the slump block before the sediment was transported by waves and currents.

Figure 4. The jetty interrupts the longshore sand transport.
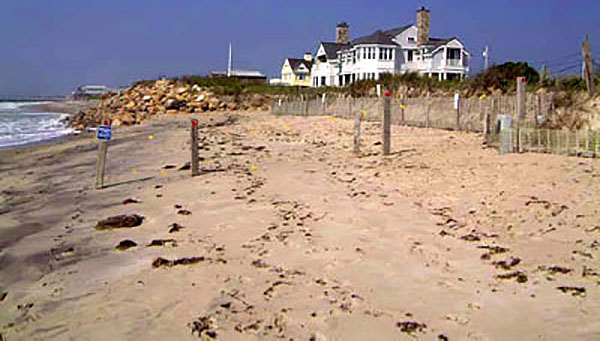
Figure 5. Lateral access is limited to low tide.
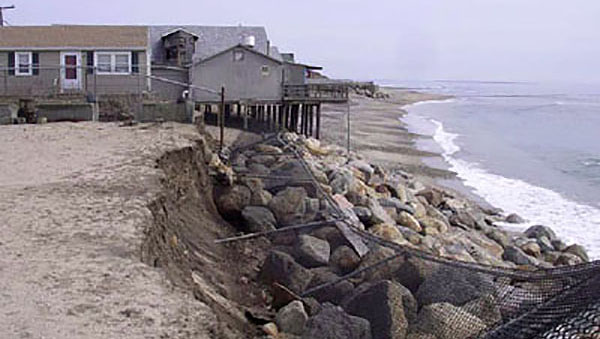
Figure 6. Many shoreline protection structures cannot withstand moderate storm energy.
CRMC advocates the beneficial reuse of dredged material. The South Coast Habitat Restoration Project is an example of beneficial reuse that has created wider beaches and has the secondary benefit of providing protection for some coastal properties (figure 7).
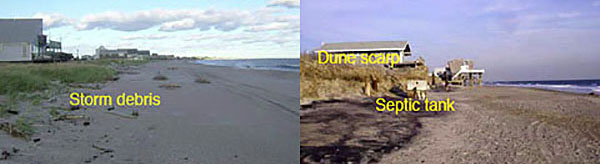
Figure 7. Beach with dredged sand on the left shows no erosional scarp. The beach on the right shows dune scarp and newly exposed ISDS.

NOAA’s outlook for the 2025 Atlantic hurricane season, which goes from June 1 to November 30, predicts a 30% chance of a near-normal season, a 60% chance of an above-normal season, and a 10% chance of a below-normal season. See NOAA definitions of above-, near-, and below-normal seasons. The Atlantic hurricane region includes the North Atlantic Ocean, Caribbean Sea, and Gulf of Mexico.
The agency is forecasting a range of 13 to 19 total named storms (winds of 39 mph or higher). Of those, 6-10 are forecast to become hurricanes (winds of 74 mph or higher), including 3-5 major hurricanes (category 3, 4 or 5; with winds of 111 mph or higher). NOAA has a 70% confidence in these ranges.

Forecast of Atlantic Seasonal Hurricane Activity and Landfall Strike Probability for 2025 (PDF) from CSU Tropical Weather and Climate Research
"We have maintained our forecast for a slightly above-normal 2025 Atlantic basin hurricane season, although noting lower-than-normal confidence with this outlook. Sea surface temperatures across the eastern and central Atlantic have anomalously warmed over the past few weeks and are now somewhat warmer than normal. Multiple indicators anticipate likely cool ENSO neutral conditions during the peak of the Atlantic hurricane season. Warm sea surface temperatures and ENSO neutral conditions typically provide a more conducive dynamic and thermodynamic environment for hurricane formation and intensification. The primary reason for the uncertainty in the outlook is the high observed Caribbean shear over recent weeks. Typically, high levels of Caribbean shear in June– July are associated with less active hurricane seasons. We anticipate a slightly above- average probability for major hurricanes making landfall along the continental United States coastline and in the Caribbean for the remainder of the hurricane season."
RI Emergency Management Agency:
National Hurricane Center Resources
Hurricanes: Science and Society – Major goals of Hurricanes: Science and Society are to provide foundational science for understanding complex scientific content, inform visitors about current scientific and technological advances, and to help visitors make good decisions prior to and during a hurricane emergency.
The following lists the relevant sections of the Coastal Resources Management Plan dealing with coastal hazards.
Post Storm Actions:
Section 1.1.14 Emergency Assents
Pre Storm Mitigation:
Section 1.1.9 Setbacks
Section 1.2.2(A) Coastal Beaches
Section 1.2.2(B) Barrier Islands and Spits
Section 1.2.2(D) Coastal Headlands, Bluffs and Cliffs
Section 1.2.2(G) Dunes
Section 1.3.1(G) Construction of Shoreline Protection Facilities.
Section 1.3.1(I) Dredging and Dredged Materials Disposal
Stedman Government Center
Suite 116, 4808 Tower Hill Road, Wakefield, RI 02879-1900
Voice 401-783-3370 • Fax 401-783-2069 • E-Mail cstaff1@crmc.ri.gov
![]()
![]()
An Official Rhode Island State Website