![]()
![]()
![]()
![]()

RI Coastal Resources Management Council
...to preserve, protect, develop, and restore coastal resources for all Rhode Islanders
![]()
![]()
![]()
![]()
...to preserve, protect, develop, and restore coastal resources for all Rhode Islanders
CHA-EZ turns 40 in October
November 8, 2017, CHARLESTOWN – The CHA-EZ beach profile in Charlestown is 40 years old, and with four decades of observations and data come a wealth of information that has informed the Rhode Island scientific community on beach dynamics, the impacts of storms, and the long-term cycle of erosion and accretion.
Beach profiles have been a useful tool in describing beach and near-shore changes, according to Scott Rasmussen, a research associate at the University of Rhode Island’s Environmental Data Center. These measurements are used to create a profile to study the make-up of Rhode Island’s coastal geology (morphology), shoreline dynamics, beach volume changes, and long-term trends. This one was established by the late Dr. Jon Boothroyd, state geologist and longtime professor at URI as the CHA-EZ (Charlestown Erosional Zone).
“Jon began this profile in 1977, shortly after arriving at URI. Jon had been profiling at other locations for years as a graduate and post-grad student,” Rasmussen said. “He knew the importance of ‘communing with the beach’ and what it could teach us.”
Simply put, anyone who regularly walks a particular beach has most likely noticed changes in its shape – at once it might be gently sloping and wide, another time carved away by the sea, with cliff-like edges – caused by storms, seasonal cycles and decades-long trends.
“By returning to the same point over a long period of time, these changes and trends can be documented to better understand shoreline dynamics,” said Dr. Bryan Oakley, assistant professor of Environmental Geoscience at Eastern Connecticut State University. “Beach profiles begin from the same spot and are measured the same way every time, so they provide a consistent, detailed record of the changes at that site.” Those documented changes can then be used to draw conclusions about adjacent areas, he said.
Beach profiles can be analyzed using very simple equipment made inexpensively from readily available materials, according to CRMC Coastal Geologist Janet Freedman. CHA-EZ was measured using the modified Emory method, also known as “two sticks and a string,” for most of its history. Recently, CHA-EZ has transitioned to using an RTK-GPS (Real Time Kinematic Global Positioning System), equipment supplied by the CRMC. Both the modified Emory Method and the RTK GPS collect elevation data that is accurate to a few centimeters, Freedman said. The RTK GPS allows data collection by a single person.
What has all of the data collected at the CHA-EZ shown? Freedman said that it has been used to better understand the relationship of mean high tide, wave dynamics and shoreline access. Researchers will use the profile to take pre- and post-storm beach profile measurements, Rasmussen said. The information has revealed how sand can return to the beach quickly, sometimes within hours, as well as the overall sand loss.
“CHA-EZ was eroded to its fullest extent as a result of the Blizzard of ’78,” Rasmussen said. “Over time, the beach widened and developed a healthy dune habitat. Superstorm Sandy in 2012 turned back the clock by reducing the profile’s volume back to the post- ‘78 blizzard state. In the last five years since then, the dune and vegetation have slowly begun to form, documenting how the beach cycle continues.”
The CHA-EZ profile is not the only one in Rhode Island. Rasmussen maintains another of Boothroyd’s profiles at South Kingstown Town Beach. Dr. John King of the URI Graduate School of Oceanography manages others along the southern shore on a monthly basis (established in the 1960s). Oakley studies five profiles along Napatree Point, five along Misquamicut State Beach, and eight on Block Island, surveyed monthly with the aid of citizen scientists.
“CHA-EZ and the other profiles have provided hundreds of URI students, graduate students, faculty, members of the media (via the Metcalf Institute) and members of the general public (though CRMC endeavors) with the opportunity to engage in field work and better understand how scientific research is conducted and used,” Rasmussen said.
Shoreline property owners, municipal planners and coastal zone managers need this historic data to understand what we can expect for our beaches and coastlines in the future, he said. The profiling results often answer the questions of how much sand did we lose; and how fast will our beach come back.
“Only by having long-term, detailed observations over multiple years and storm events can we begin to answer those questions,” Rasmussen said.
“I think that Jon Boothroyd would be pleased to know we are able to continue his work using the latest technology,” Freedman said. “I think it is vital that the work continue in order to better understand changes to the beach as sea levels rise as well as storm impacts.”
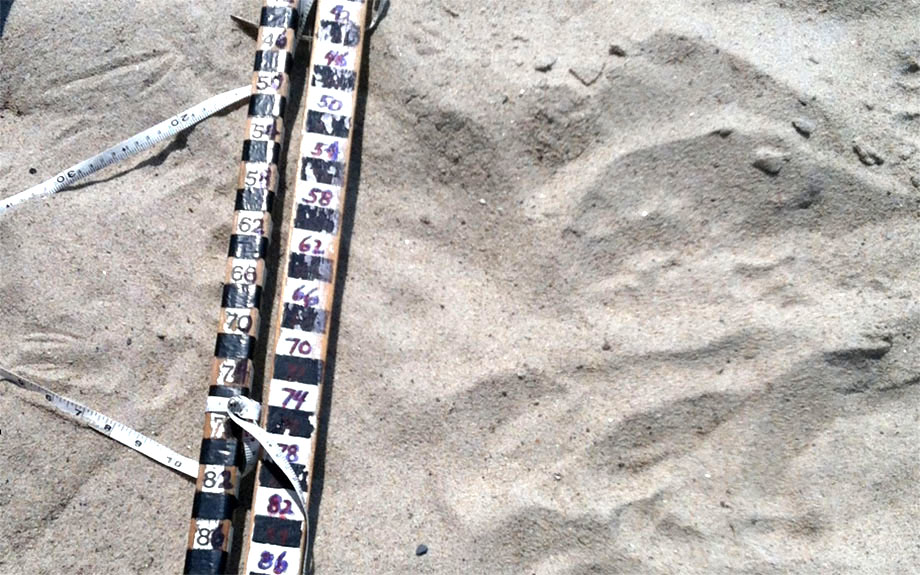
The “two sticks and a string” method
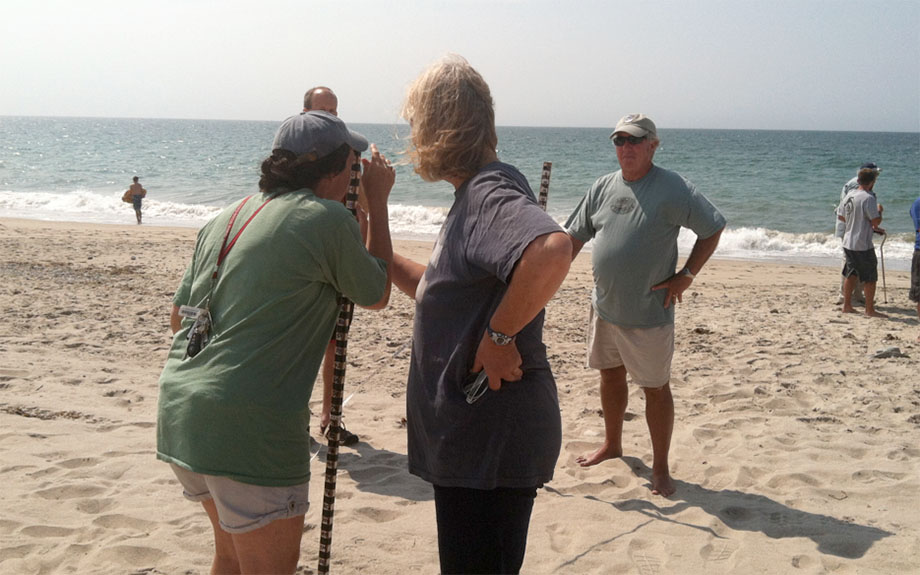
CRMC’s Janet Freedman instructs the “two sticks and a string” method
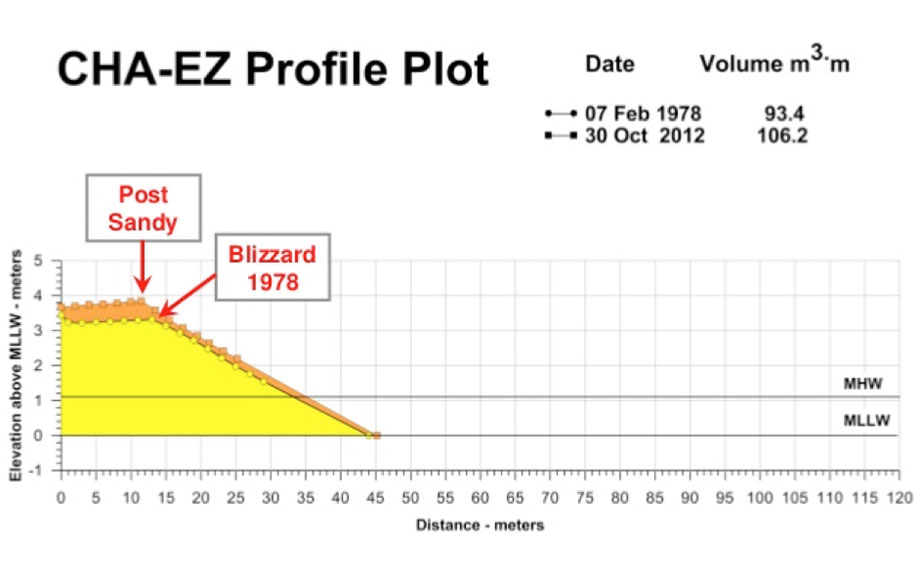
CHA-EZ profile after the Blizzard of ’78 and the post-Sandy profile (graph courtesy of B. Oakley)
Stedman Government Center
Suite 116, 4808 Tower Hill Road, Wakefield, RI 02879-1900
Voice 401-783-3370 • Fax 401-783-2069 • E-Mail cstaff1@crmc.ri.gov
![]()
![]()
An Official Rhode Island State Website