![]()
![]()
![]()
![]()

RI Coastal Resources Management Council
...to preserve, protect, develop, and restore coastal resources for all Rhode Islanders
![]()
![]()
![]()
![]()
...to preserve, protect, develop, and restore coastal resources for all Rhode Islanders
CRMC, URI unveil flood maps for East Bay
January 14, 2019, WAKEFIELD – The Rhode Island Coastal Resources Management Council (CRMC) and the R.I. Shoreline Change Special Area Management Plan (Beach SAMP) team have unveiled new inundation maps for the Rhode Island communities of Barrington, Bristol, and Warren, particularly susceptible to the impacts of sea level rise and flooding.
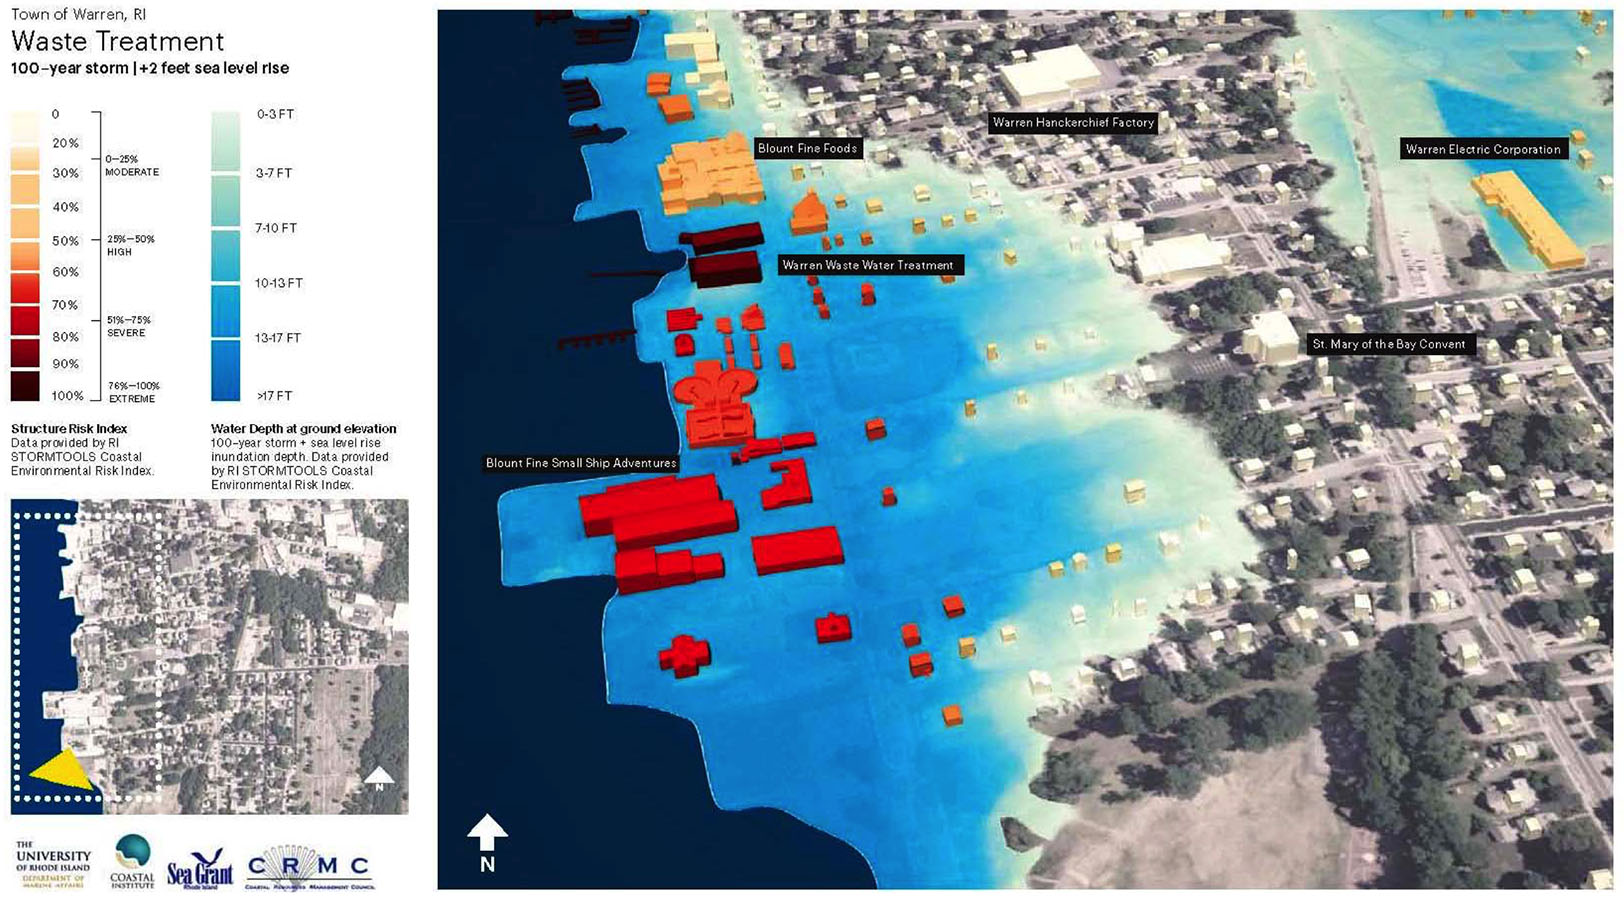
Visualization of the Town of Warren’s waste water treatment facility, and its vulnerability under a scenario of 2 feet of sea level rise and a 100-year storm event.
The new maps and visualizations are an addition suite belonging to the SAMP tool, the Coastal Environmental Risk Index, or CERI. The CRMC introduced the mapping tool, which provides an objective, quantitative risk assessment of both structures and infrastructure from storm surge and waves in the context of sea level rise, in 2016 as part of its development of the SAMP. The maps were developed by Dr. Malcolm Spaulding and his team of researchers at the University of Rhode Island.
Funding for the new maps came from a U.S. Department of Housing and Urban Development grant, and the three communities have been added to the other CERI maps of the city and towns of Warwick, South Kingstown, Narragansett and Charlestown. Planners can utilize the GIS-based tool to make decisions based on storm events to anticipate risk to infrastructure, property, and emergency services along the coast. CERI builds on the STORMTOOLS surge and wave maps, and the Beach SAMP’s shoreline change maps, as well as data from the U.S. Army Corps of Engineers, North Atlantic Comprehensive Coastal Study.
The CERI visualizations calculate percent damage for structures and infrastructure in the event of storm surges, including flooding and waves, and taking sea level rise and shoreline change into account. CERI combines all of these factors for a total damage function assessment.
“We looked at three communities that, in addition to Warwick, are the most exposed when it comes to sea level rise, storms, erosion, flooding,” said CRMC Executive Director Grover Fugate. “We met with the towns in advance and asked them to identify areas of concern for them, so we’ve done a series of visualizations for those particular areas.”
The value of these CERI maps is clear, Fugate and Spaulding said. Not only will they allow for town and city planners to anticipate risks from storm events and sea level rise to particular areas, but based on the visualizations, planners can consider how they want to protect existing structures and infrastructure or relocate them if possible.
“Application of CERI to the towns of Barrington, Bristol and Warren have provided critical information to allow town managers, planning officials, and the community to clearly understand the risk that these three low lying communities face from storm surges in the presence of sea level rise,” Spaulding said. “Three-D visualizations of the damages, on a structure-by-structure basis, have proven very effective in highlighting and communicating the areas at most risk.”
Stedman Government Center
Suite 116, 4808 Tower Hill Road, Wakefield, RI 02879-1900
Voice 401-783-3370 • Fax 401-783-2069 • E-Mail cstaff1@crmc.ri.gov
![]()
![]()
An Official Rhode Island State Website